

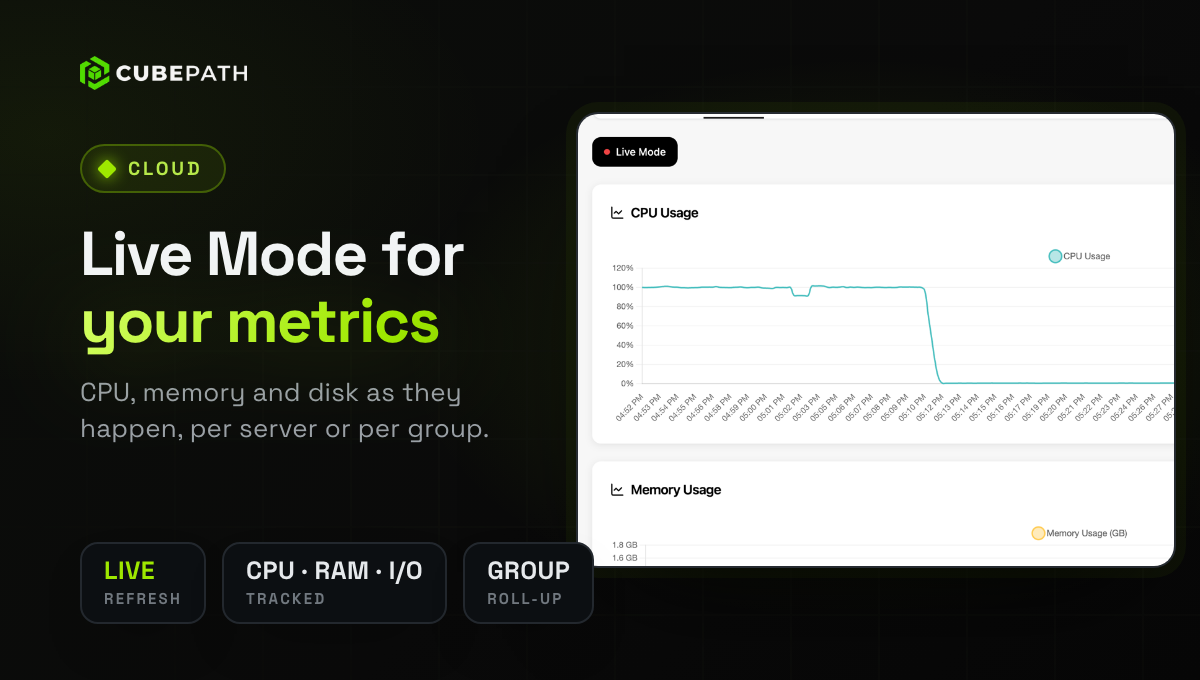
The Metrics tab of a Cloud VPS now has a Live Mode. Turn it on and the CPU, memory, disk I/O and network charts keep updating as the data arrives, so a spike shows up while it is happening instead of after the fact.
The same metrics are also available at Availability Group level, aggregating the whole group into one view so you can judge whether it needs more or fewer resources.
Open the Metrics tab of any instance in your panel: