

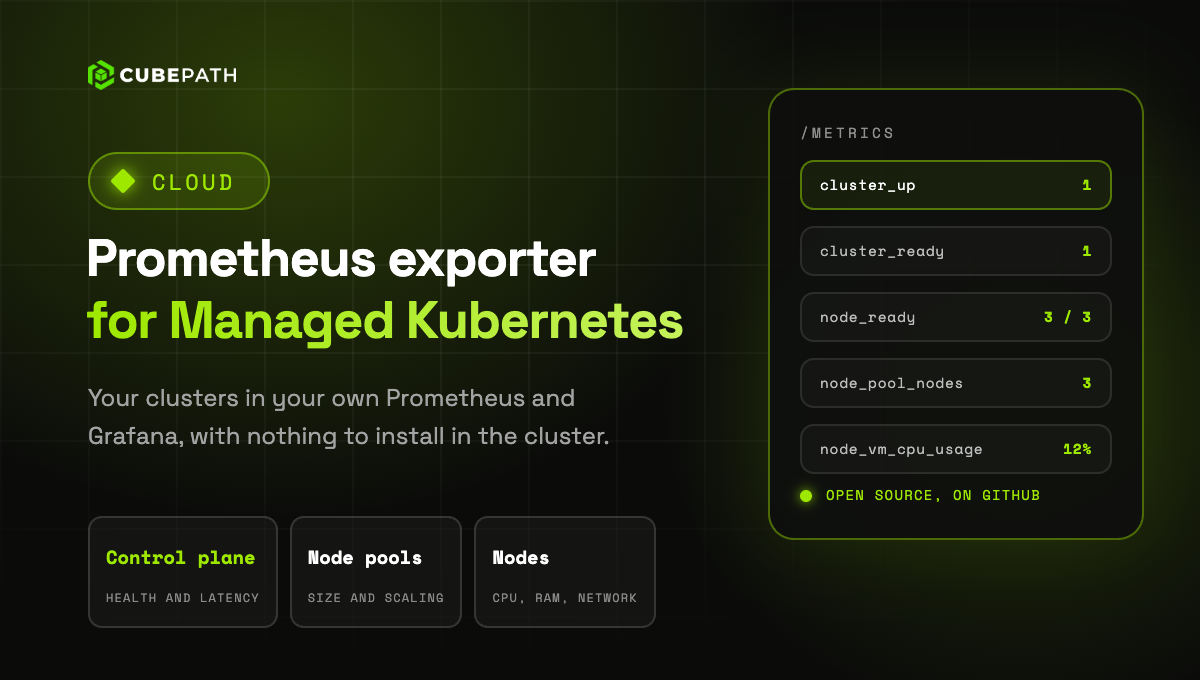
You can now monitor your Managed Kubernetes clusters from your own Prometheus. The new open source exporter gives you the control plane, the node pools and every node of your clusters, with nothing to install inside them.
- Control plane: whether the API server is up and ready, its latency and when its certificates expire.
- Node pools: current, desired, minimum and maximum nodes, and autoscaling.
- Nodes: ready state and conditions, plus CPU, memory, disk activity and network of each one.
- Ready to use: a Grafana dashboard and alerting rules are included.
Run it with Docker or as a binary, with an API token that can read your clusters. Because it does not run inside the cluster, it keeps reporting when the cluster is in trouble.